Saturday, January 28, 2012
Cell Phone Usage 2011 and All Time
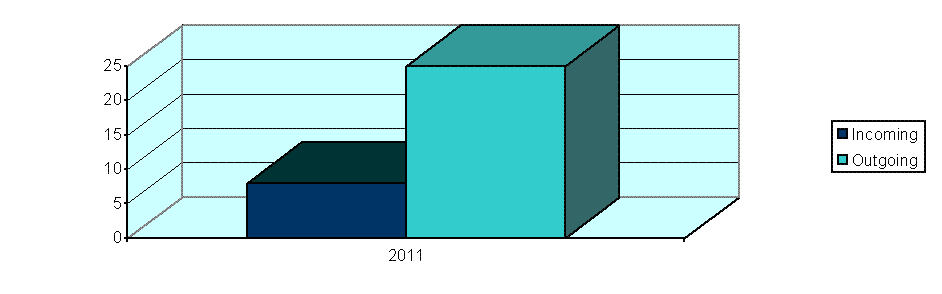
Since I first got it in 2008, I haven't often used my cell phone--it's mostly for travel and emergencies and the rare case where I am needing two phone lines at once. Hence, because the cell phone is usually off, most of my calls are outgoing rather than incoming. Here's the breakdown for 2011 through the first half of October:
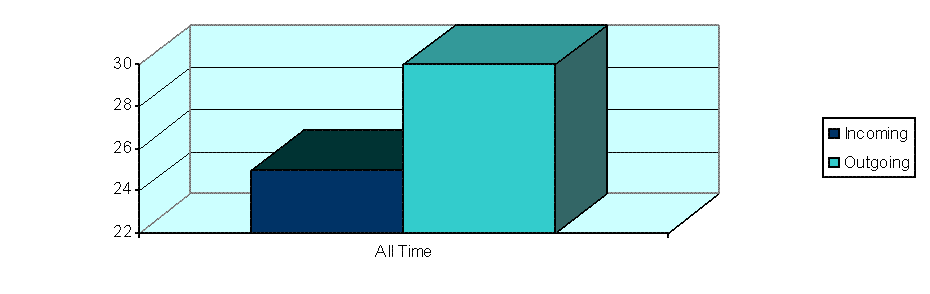
Here's the breakdown for all time:
Clearly I did a lot more calling out in 2011 than in previous years.
Saturday, January 21, 2012
Car Repairs by Mile and Year
The month of September was a frustrating one with regard to my car--I found myself in the shop three times for three unrelated things. I hadn't had to make many major repairs on it since purchasing it back near the end of 2005. Or at least, that's how it seemed. So I decided to go back and check my records. Here is a chart showing how many major repairs (anything that isn't routine maintenance like tire rotations, oil changes, or new air filters) I've had to make since I purchased the car:
I suppose that 2008 through 2010 in part have spoiled me, with so few necessary fixes.
I'm just now getting to 100,000 miles. Perhaps, that has something to do with the sudden uptick in problems, though my model is one that typically lasts well beyond the 100,000 mark in others' experience. Here's the mileage at which I had to make major repairs since 2005:
It looks like I was doing really well for about 20,000 miles, but there's been a noticeable uptick in repairs in the last 10,000. It was a very trying September through November this year (ironically, the last mechanic who worked on my car said I'd done a really good job of maintaining it--well, yes, indeed, I have, but that doesn't seemed to have helped this past year).
I'm just now getting to 100,000 miles. Perhaps, that has something to do with the sudden uptick in problems, though my model is one that typically lasts well beyond the 100,000 mark in others' experience. Here's the mileage at which I had to make major repairs since 2005:
Saturday, January 14, 2012
Long Distance Calls for September 2011
Saturday, January 7, 2012
Types and Subjects of Charts on My Blog in 2011
Given that the year drew to a close last weekend, I thought it would be a good idea to review just what has been charted in the past year. What exactly are my obsessions and in which way do I prefer to express them? Apparently, my favorite expression of them is in the form of a pie chart, as evident in the chart below.
As for subjects (some entries probably could have fit into two or three spots, but I forced them into one for the sake of this chart below), the selection is much more balanced, though places took the lead.
Saturday, December 31, 2011
Movies by Theater
I wanted to see how the places I go to see movies has changed since I moved here and how much influence having a DVD player has had on where I go to see movies, so the chart below I think shows that to some extent. Cheap older films can now be rented, so I have fewer reasons to go see such films at the Tate Student Center. Art films, which were hard to find in town but usually showed at Beechwood, are now shown regularly at Cine. (I was surprised to see how many films I likely used to go to see at Beechwood.)
However several other factors influence where I see movies as well. Some entities have stopped showing films, such as the Georgia Theater, which does only music now. Other cheap venues have also opened up, such as the second-run theater at the mall. Finally, the price of films went up to a level that I no longer felt like I could justify attending them at full price unless I was really intent on the movie.
Looking at my list, I realized that some films I just don't remember at all--and often I wasn't quite certain where I saw the film, so I had to make an educated guess. Hence, these charts are to an extent based on estimate from memory rather than cold hard stats. They are broken down between 2001-4 and 2005-11 because 2005 is when DVD became available to me.
2001-4
2005-11
Labels:
Local Life,
Local Spending,
Movies,
Pie Charts
Saturday, December 24, 2011
My U.S. Map by Decade
I wanted to see how much where I live affects how much time I spend in various states. It's interesting how the trajectory changes as I moved from the West Coast to the East Coast. The 1990s, where I lived in three different states and did significant in-state travel represent the time when I was present for a time in the most states. The 2000s, where I've spent most of the decade in Georgia fill in a few of the eastern and midwestern states, but the West Coast now has started to look anemic, as the East Coast did when I was younger. One difference: I have family on the West Coast, so there's still an excuse to go back.
In the maps below, the black states are those I lived in during the decade. The dark gray states are those I spent at least one contiguous week in, and the light states are those I at least "touched."


In the maps below, the black states are those I lived in during the decade. The dark gray states are those I spent at least one contiguous week in, and the light states are those I at least "touched."
1970s
1980s
1990s
2000s
So far the 2010s are shaping up to look similar to the 2000s.
Saturday, December 17, 2011
IM Chats by Year
When I first got online at home, around 1999, I became an e-mail fanatic. Probably, about six months later or so, I discovered instant messaging, and that became a constant for many an evening for probably a year or so. But the IM usage dropped off precipitously once I moved here. There are likely multiple reasons for that: I have more friends here. I have less interest in trying to get dates online. Chatting online is no longer "new" to me, so its novelty has worn off. And finally, chatting online no longer seems as easy to accomplish as it once did.
By the latter, what I mean is that Yahoo! Messenger, AIM, MSN Messenger--these services all no longer seem as prolifically used as they once were. Many folks text rather than IM, or they IM straight from the phone, or they chat via a social network like Facebook, and since one of the main reasons I chatted was to meet new people and Facebook seems more structured around helping you stay in contact with people you already know, I'm not as motivated to chat on it (but see above also: there are a lot of things these days I'd rather do than chat online).
Nevertheless, I present what few statistics I have in this regard, which only takes into account chat from 2005 on, when I got this particular computer. The chat stats for 1999 to 2005, unfortunately, were lost in a crash. By 2005, chat in my life was already in decline; nevertheless, if you can imagine the trajectory shown here going backward, you'll probably see a pattern you could plot out to years before.
The blue line on top represents chats along with chat attempts (often people don't answer an opening line on IM); the red line on bottom represent actual chats. Where the blue disappears, all attemps to chat were successful.
The 2011 chat is the reason for my blog entry. I had a wonderful online chat one evening with a gal I'd e-mailed back and forth with a few times. But to note how my feelings about chat have changed, I really felt more like talking on the phone with her, but more than that, I felt like being out on an actual date. It was loneliness after the cancellation of a date with another gal that caused me to check into Facebook in the first place. A chat, as wonderful as it was, was a poor substitute.
By the latter, what I mean is that Yahoo! Messenger, AIM, MSN Messenger--these services all no longer seem as prolifically used as they once were. Many folks text rather than IM, or they IM straight from the phone, or they chat via a social network like Facebook, and since one of the main reasons I chatted was to meet new people and Facebook seems more structured around helping you stay in contact with people you already know, I'm not as motivated to chat on it (but see above also: there are a lot of things these days I'd rather do than chat online).
Nevertheless, I present what few statistics I have in this regard, which only takes into account chat from 2005 on, when I got this particular computer. The chat stats for 1999 to 2005, unfortunately, were lost in a crash. By 2005, chat in my life was already in decline; nevertheless, if you can imagine the trajectory shown here going backward, you'll probably see a pattern you could plot out to years before.
The blue line on top represents chats along with chat attempts (often people don't answer an opening line on IM); the red line on bottom represent actual chats. Where the blue disappears, all attemps to chat were successful.
Subscribe to:
Posts (Atom)